Negative correlation occurs when the rise in one item accompanies a fall in another.
Example of Negative Correlation
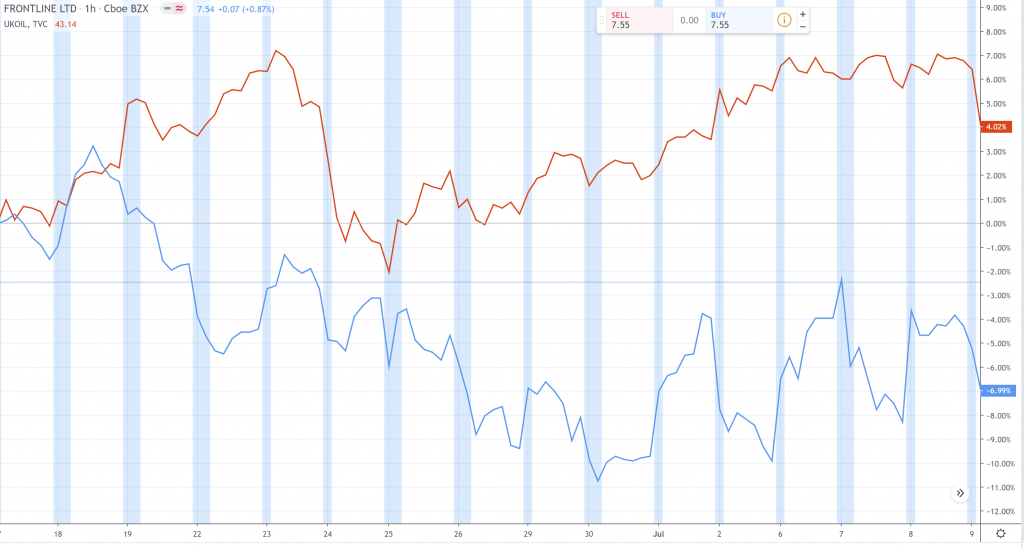
When gas prices go up, stocks of shipping companies tend to fall, and vice versa.
When interest rates go up, bond prices tend to fall, and vice versa.
In the short run, when stock prices go up, bond prices tend to fall, and vice versa.
Why is this Important to You?
Negatively correlated assets provide diversification to an investment portfolio.
Imagine you had a portfolio with all positively correlated instruments. If the price of one of the instruments increased, then all the other prices will theoretically increase as well. By doing this you are essentially putting all of your eggs in one basket. If you were wrong about the market direction, then you lose on all of your investments.
The current market conditions completely determine the success of a non-diversified portfolio. As a trader, your goal is to use strategies that take control of making profits regardless of the market situation. Therefore, managing risk is essential to increasing your effectiveness.
Note, however, that decreasing your risk in this way often lowers the highest potential return. For instance, if you had two perfectly negatively correlated assets then your return would be 0. This is because the profit from one asset would be canceled out by the loss in the other.
On the flip-side, managing your risk increases your probability of having a positive return. This is where the risk/reward trade-off comes from.
Some risks are inherent to a sector which is also something to be mindful of. For instance, in a year of drought, the entire farming industry will be affected. This emphasizes the importance of holding assets across multiple sectors to achieve a balanced portfolio.
Understanding Negative Correlation
To be a little bit more precise, correlation is a statistical concept that measures the linear relationship between two variables.
The correlation coefficient is a number between -1 and 1 which describes the strength and direction of a correlation.
Two perfectly correlated have a correlation coefficient of 1.
Two perfectly negatively correlated variables have a coefficient of -1.
If the coefficient is 0 then we say there is no linear relationship. We say no linear relationship since the correlation coefficient cannot determine whether there are other more complex relationships.
How do you chart a correlation?
In practice, we can visualize the correlation between two stocks by fitting a linear regression line through historical price data. The correlation coefficient determines the slope (in red) in the example below.
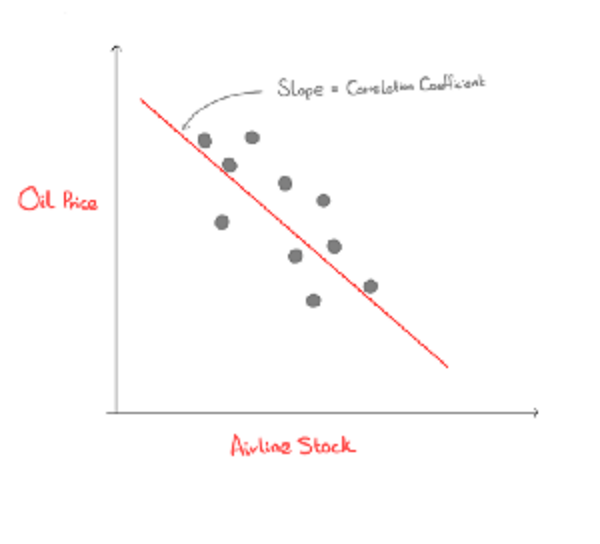
This graph is a little extreme but it shows the relationship between oil prices and the price of airline stock. Since the price of fuel is such a major factor in the airline costs, it plays a direct role in profitability of airline operations. Therefore, as the cost of oil rises, the price of airline stock falls.